
How The Stealth Correction Is Ending
A look at the debt bubble that doesn't exist, the conspiracy behind the recent selling in stocks, and the indicator that is about to give us a green-light for a bounce.

In both a vibes and statistical sense, Thursday’s selloff was not normal.

This chart shows the rolling 2-hour rate of change for the Nasdaq. The percentage change was the most negative we’ve seen since the April Tariff Tantrum.
It felt like someone was a forced seller and turned on the “hit the bid with no concern for liquidity” algorithm.
Quants are pretty good at sniffing this out, so the liquidity thins out and the bags are dumped.
It was a sell program, not a market panic. Yet given the vibe of the selloff, it’s enough to get my attention.
I’ll be making the case that the current market risk is positional, not due to any near term fundamental risks. I’ll also show you that we are close to a “normal” reset, and the current conditions don’t suggest a massive unwind, but rather a market correction that will be more time based than the indices getting killed.
This past week’s low doesn’t have to be the bottom of this recent correction. Stocks could have one or two more pukes before there’s a full reset.
Yet much of the bloodletting has already happened.
Chum In The Water
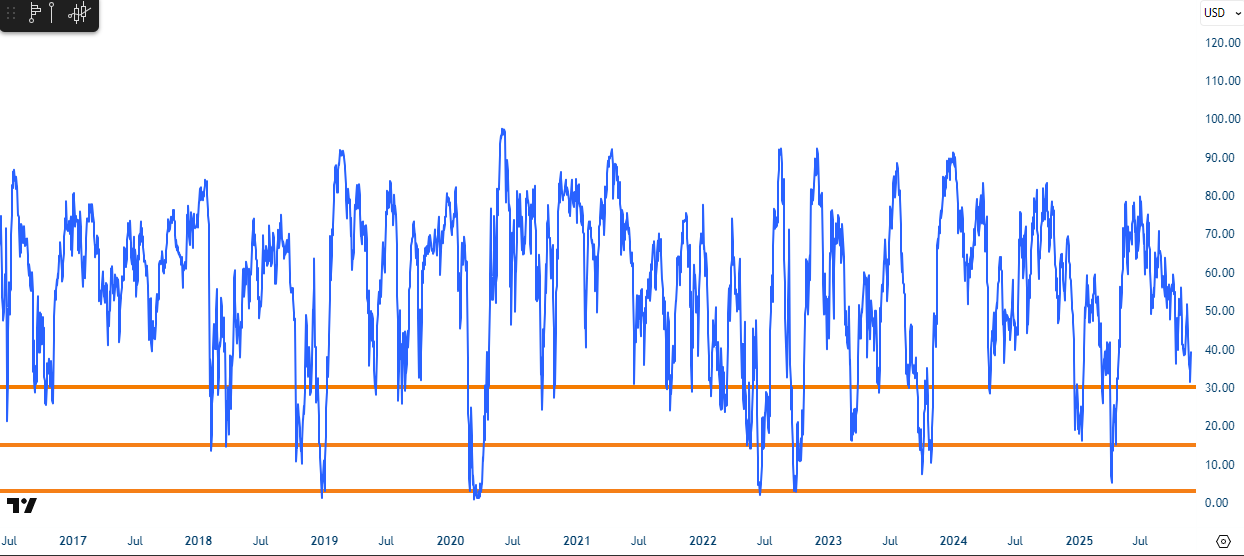
This is S5FI, an indicator that shows the percentage of stocks above the 50 day moving average. It’s one of my favorite long-term indicators for timing extremes.
A moving average is adaptive, so it rises alongside price, and it will eventually get taken out.
This also takes an “equal” look market breadth, and it shows that while the S&P 500 is only off about 5%, about two-thirds of the index is below its 50 day moving average.
This is not shocking to market participants that have been dialed in, but if you’re Johnny Passive that checks your balance every once in a while, then you’ve got an 8% drawdown after a 58% rally from April.
That means most longer term players are not forced sellers, and the Mag7 are doing some of the heavy lifting so everything is resetting underneath the surface.
The bearish thesis would be that the market can’t bottom without everything being taken to the woodshed. That would be fun, but we don’t have the background market context for that kind of liquidity pull.
8% drawdown. After a 50% rally.
What Market Are We In?
With the S5FI hitting 30, that’s a normal, vanilla pullback. We are arriving into that zone, meaning that you can still have a few shakeouts before the market starts to resolve higher.
If the indicator cracks 20, those are market corrections that traders will remember, but most of the investing public won’t.
Anything under 10-15 and those are the corrections with names, like hurricanes. Tech Wreck. Tariff Tantrum. Fiscal Cliff.
This selloff does not feel like a hurricane. More like a hangover.
Overhedged. Again.
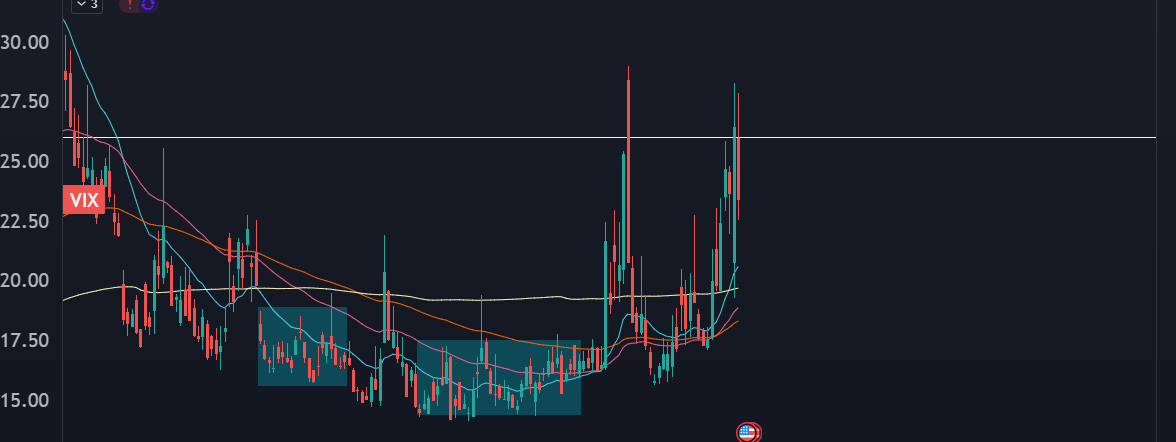
The last time stocks had a proper rug pull was in October 10th, jamming the VIX above 25 and sucking in fresh hedgers.
If you bought November hedges, then it’s a kind of cruel fate that the market roundtrips to the Oct 10 lows, but you completely lose on those hedges.
We’re back again with the VIX catching 25 again, with new hedging in place. If we don’t get another round of the scaries like we saw on Thursday, then I’d expect the market to auction higher as vol unwinds a little more.
Exit Liquidity
If we do manage to have a bounce, I expect the first round of obvious short levels to fail miserably. But into those covers, there’s plenty of inventory that could be motivated to sell:
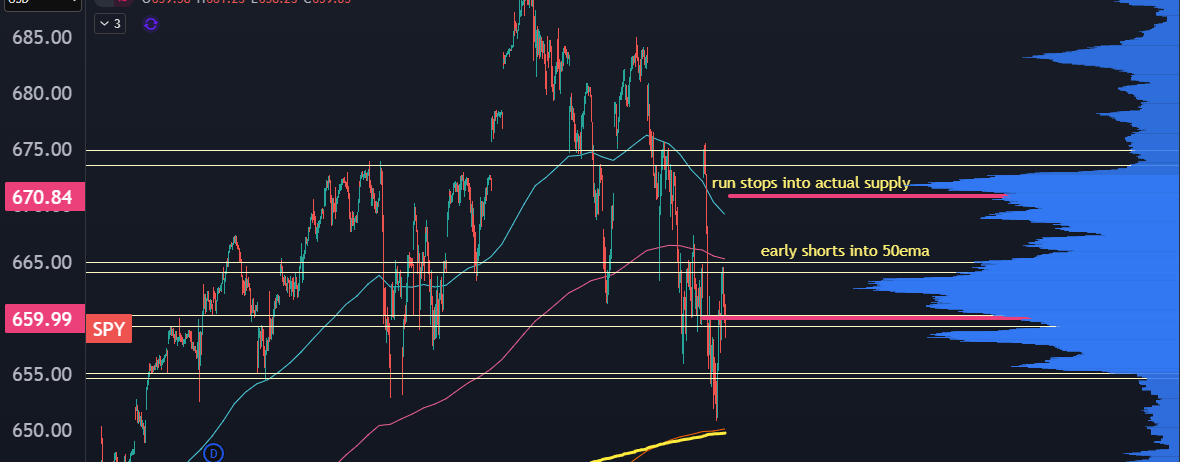
This will be the tension I’m watching. The market just had a failed breakdown and had a new round of protection bought that keeps a bid in the market. If we keep seeing selling that has the nuance of a sledgehammer, then they’ll just take the market to the woodshed.
But the tension is two-sided. We’ve had a reset underneath the surface, and the VIX was oversensitive yet again.
Base case for the market is still upside drift but still in the context of a range. The early shorts get smoked but the second or third spot could be a great short or to layer on some bearish exposure.
Most of my focus has been on positioning… what about the big ugly narrative?
The Debt Nothingburger
Price action often leads narrative. We came into November with a ton of resolutions with Tariffs, China trade deals, and Fed cuts.
When there’s no good news left to get priced in, that’s a signal. Because then late, low-information investors come in and give an out for those who bought the wall of worry but don’t have any equity risk premium left in the trade.
Then price moves around a bit, we see a decent selloff, and then everyone in the markets starts looking for reasons glom onto.
There’s some rumblings about the Fed, and some volatility in rate expectations into December could be priced in.
But this is, yet again, about AI.
If you consider the hottest momentum sectors in October, they all had some kind of AI attachment.
Infrastructure, Power, Fiber, Turbines, GPUs, and so on.
They all had a hard reset. And on the large cap side, think about the names that have taken it on the chin the hardest…
AMZN, DELL, ORCL, and META
What’s coincident with these names is that they’ve all issued billions in new debt to help fund their AI buildout. They have incredibly high sensitivity due to any shift in the AI narrative.
And we’ve seen one. Some of it is perceptual, where OpenAI dumbed down their models a bit and we haven’t seen another tech reveal that restarts the hype cycle.
The big question is whether the companies can satisfy their new debt obligation from reaping the rewards of next year’s AI cycle. Because if they can’t, then equity owners are the first to get kicked in the teeth.
And it doesn’t help when the credit default swaps for ORCL are skyrocketing. In fact, I think selling a basket of AI related equities in the tech space is an incredible hedge against fading the ORCL CDS move.
But I just don’t see how this round of debt matters that much.
Here’s some numbers that ChatGPT hopefully didn’t make up:
Oracle’s bond package was $18B, with coupons ranging from 4.5% to 6%. If the math is right, then you’re looking to pay out about $1B per year.
They guided $67B in revenue for the next 12 months. ORCL already has a ton of debt on its books, but marginally it doesn’t seem too big.
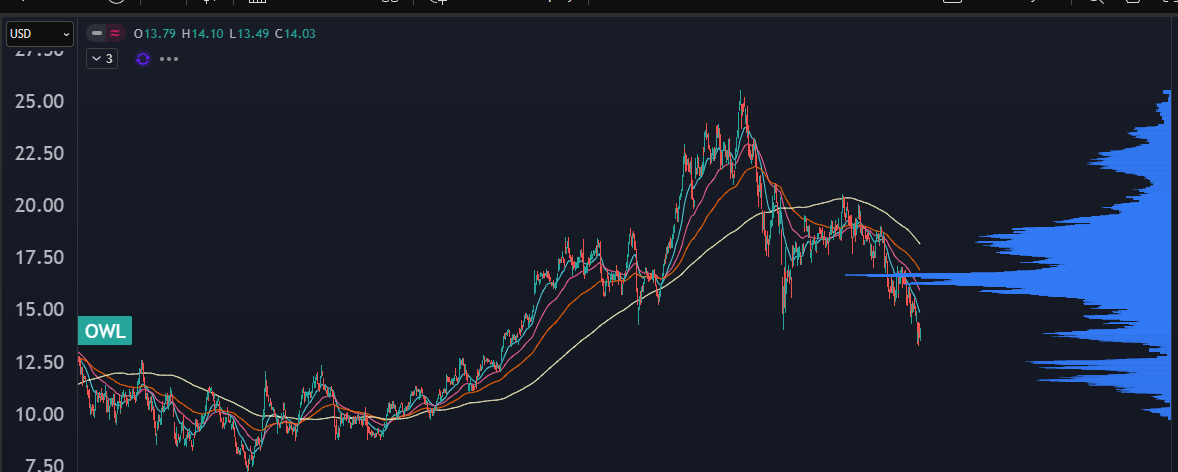
The same holds true for AMZN and META, and the sketchiest leverage would be in smaller names like CRWV. The biggest near term risk seems to be in the smaller space or in private credit, so I’ve got Blue Owl’s equity (OWL) on my screen, because I’d expect shorts in that name to sniff out any accelerating problems before other markets.
The market is starting to show some smoke, and the options market is hedging for fire. But as time goes on and panic subsides in the AI debt markets, then you start to carve out a bottom in the market.
And with a good chunk of stocks under the surface already well reset from their highs, it’s time to start looking for new positioning.
For Convex Spaces Clients, we’ve got a few relative strength setups that look ready to bust out into new all time highs. We’ve also got a few names that have been runners in the past and are ready for a reload.
If you aren’t yet a Convex Spaces Client, we’d love to have you. You’ll get trade setups and the best options trade to maximize the juice you get out of the squeeze. Become a Client here.
