
How to Do "Discreta-Quant" Trading
A Live Case Study On Playing the Pullback in DELL

“Buy the dip!”
Yeah, it’s that easy. Just wait for a pullback, pick up the stock, and sell at a tidy profit as the stock rips to new highs.
In reality, it looks nothing like that. The Dip is rarely clean, and often a knifefight. You’ve got institutional buyers that are hunting for stops, pulling bids and placing iceberg orders just underneath.
Then there’s option unwinds, extreme sentiment, and a puke in the stock where you finally kill the position, throw up your hands and say “I’m out!”
And then the stock bottoms.
I’ve been there. You’ve been there. Sometimes it’s just a bad beat, but other times it’s because you’re lacking the context behind the trade.
This is where Discreta-Quant trading comes in.
If you’ve ever played poker, you can have the odds memorized inside and out, but you still have to look up and get a feel for the other players at the table.
It’s both art and science.
DQ Trading In Action
I’m looking to buy the dip in DELL:
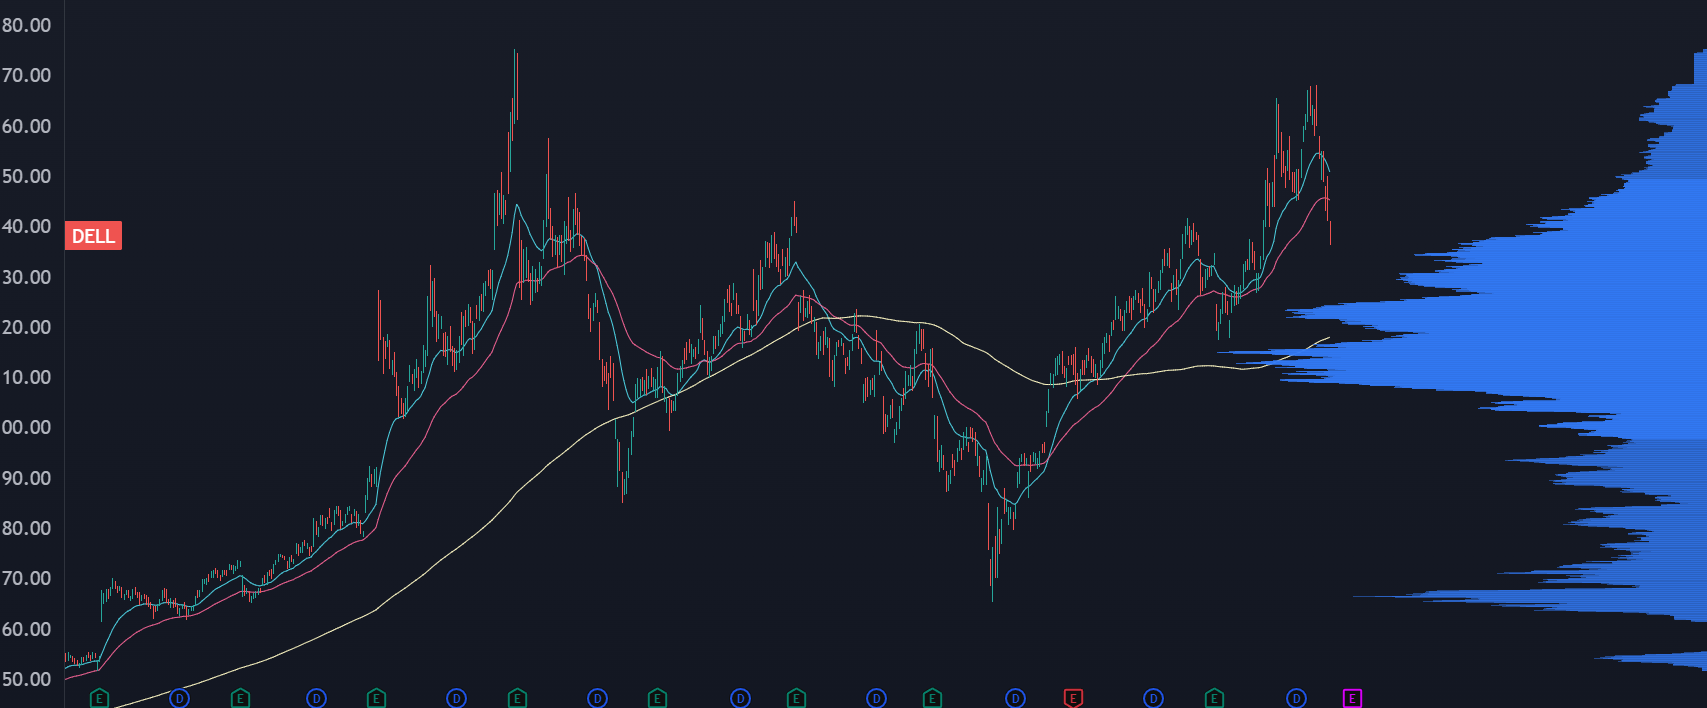
It’s been a good pullback, the stock recently undercut the lows, and there’s an acceleration to the move that tells me a bottom could be coming soon.
Yet it’s just a feel. What if we got some quantitative data to stack onto this idea?
There’s two indicators you can use to help give you a quantitative backing for a trade setup.
This is an indicator that I had coded up years ago before I realized it was available out of the box on most platforms.
It looks at the percentage distance from a key moving average, in this case the 20EMA:
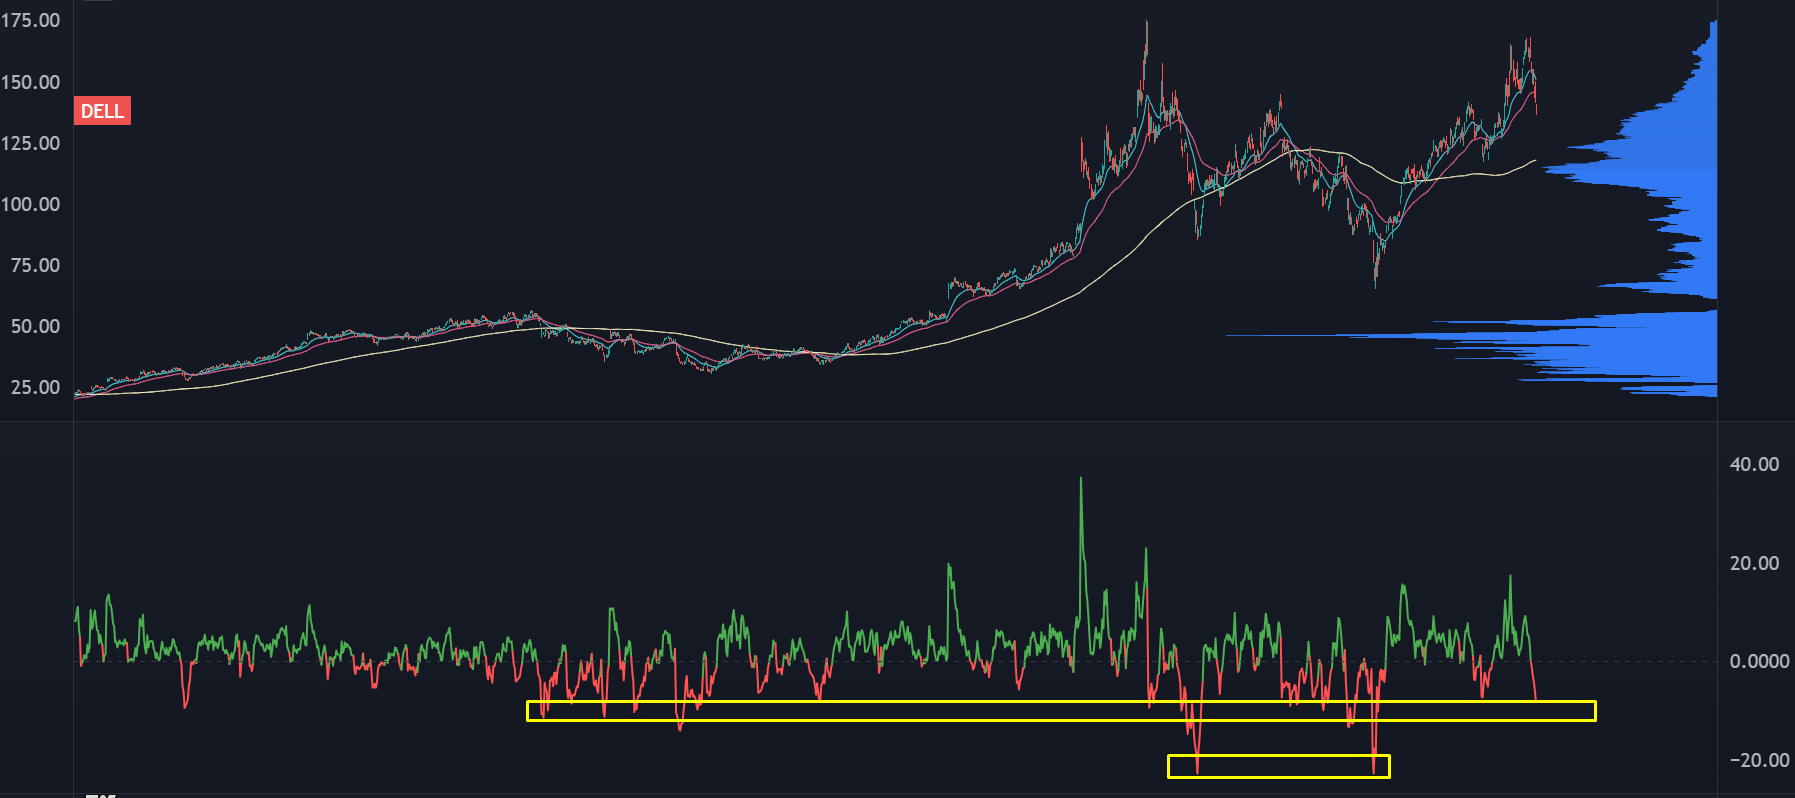
Within a 20 day window, the stock tends to get to extremes as it comes into -12% under the 20EMA.
I like to add a “context window” to this study, basically asking what this range looks like when the stock is above or below the 200. Because pullbacks in uptrends have a completely different magnitude than downtrends:
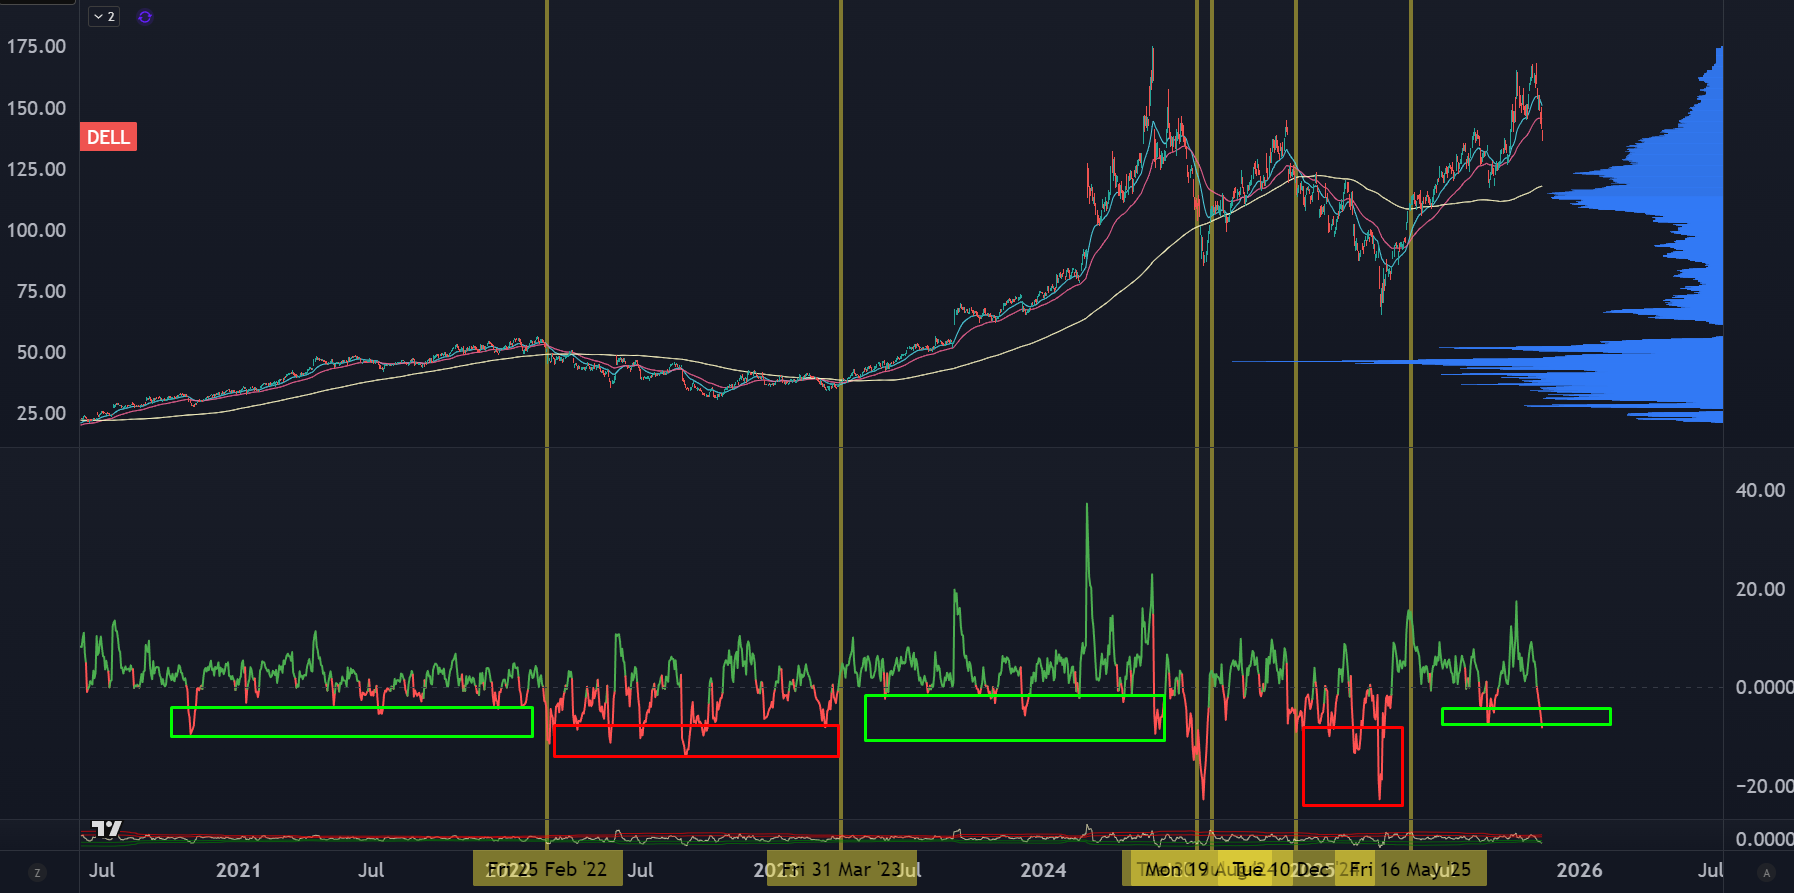
When the stock is above its 200EMA, the drawdowns are small and tame, but when it’s under the 200EMA, it gets wild with much larger pullbacks.
This is where discretionary context comes into play, because your experience in the markets helps a ton when weighting the probabilities.
In 2021 drawdowns were low because it was 2021 and everything was strong.
There was also a very negative reading in the Fall of 2024, but preceding that move was a parabolic blowoff followed by a disastrous earnings gap down that led to a hard momentum unwind.
Current Conditions
This pullback seems to be a hangover from recent AI dealflow news, similar to what’s going on with ORCL. While the stock does have earnings coming up, the AI tailwinds are still there.
In October, they raised guidance on revenue and EPS… and the timing was in between earnings events so we know the next round of numbers are still going to be solid.
The company did have a new debt offering, but it was a refinancing rather than new issuance. This could be part of the hangover where investors are spooked about all the new AI debt deals without realizing that DELL’s debt is not an aggressive expansion but just a rollover.
Indicator #2: Turning Point Indicator
I built this about a decade ago specifically for options trading. It shows the rate of change in the context of a volatility window:
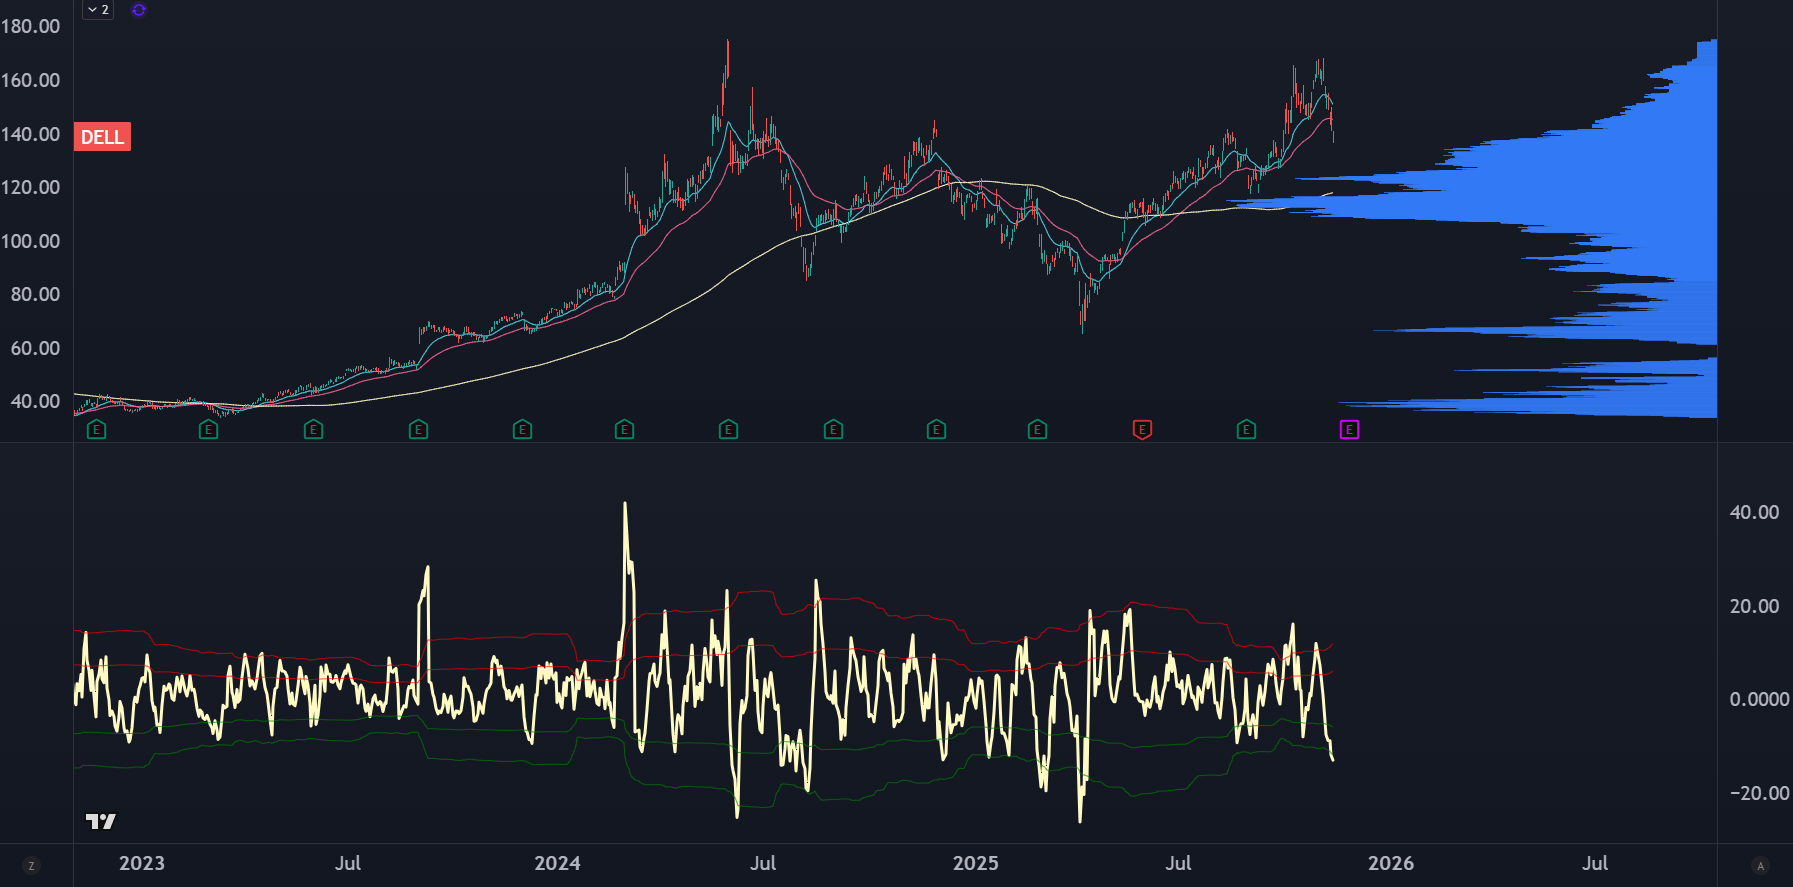
The way I use this is I “anchor” it against the recent pivot highs. This selloff is 8 days old, so I use an 8-period TPI, which shows this is a statistically significant selloff.
But this is where I find an extra edge. I will extend the timeframe out to an options expiration date, in this case December opex. We’ve got 38 days until that, so if we add on the 8 days from the start of the selloff we get a window of 46.
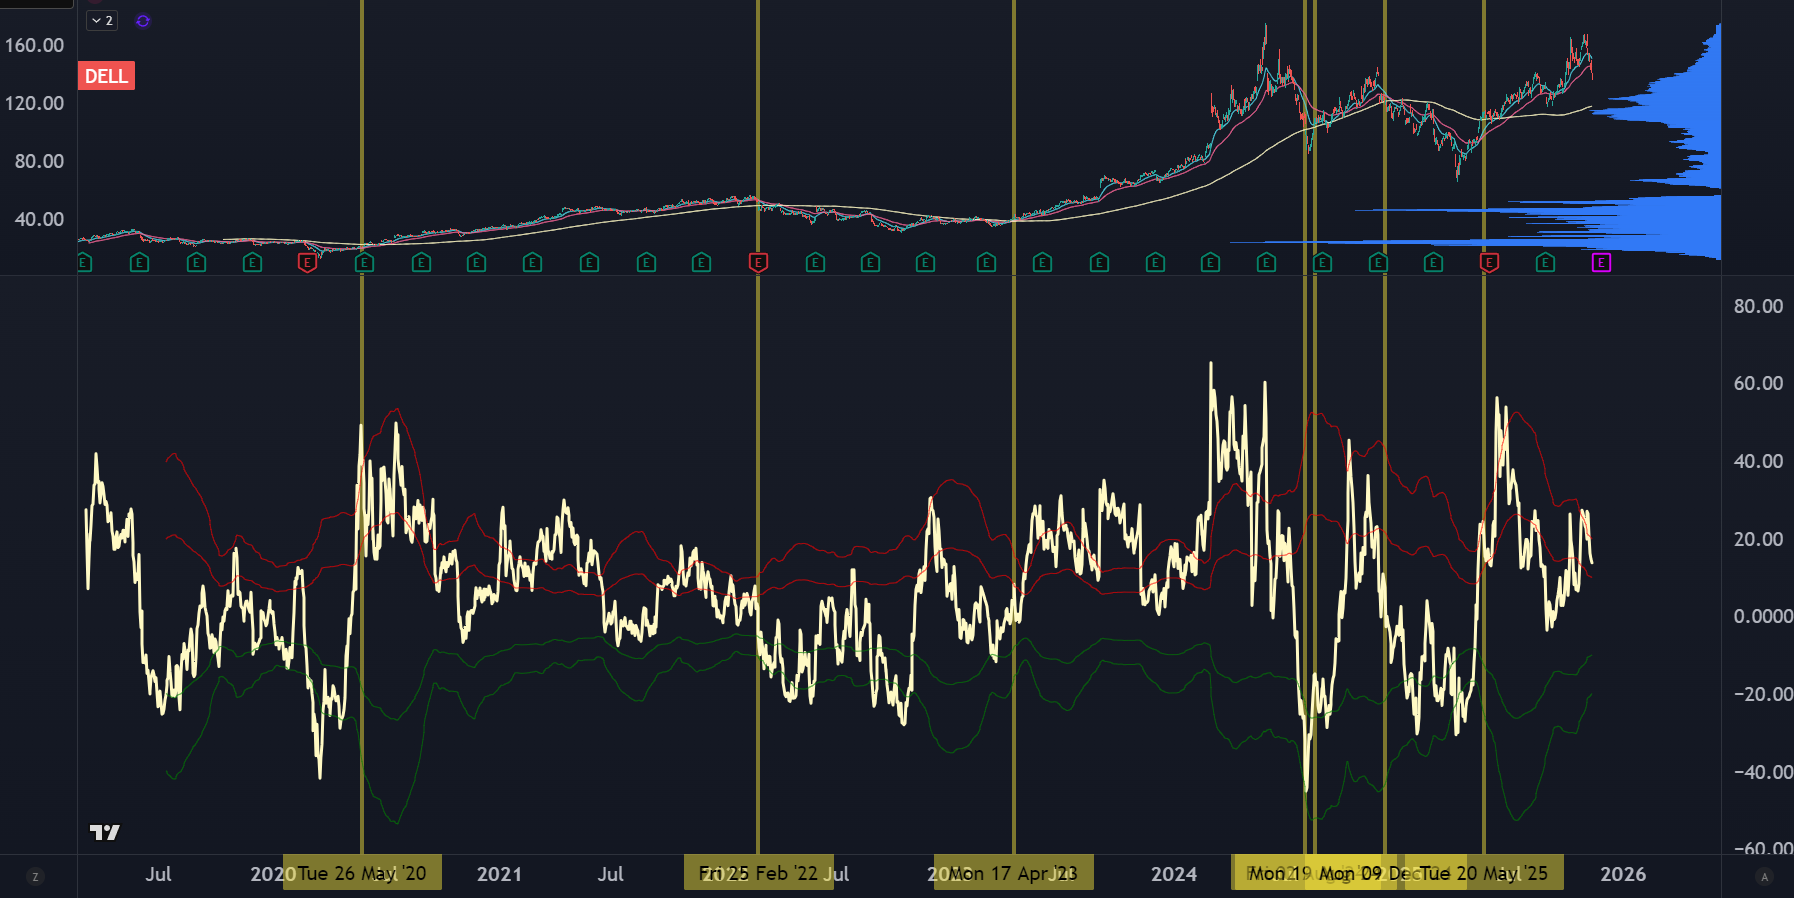
When the stock is getting absolutely crushed, it has seen drawdowns of 30% within this time window.
But we’re already 18% off those highs. It’s possible that we can see another 12% drop, but is it probable?
What is the options market pricing in? Of course there are earnings up on deck, but they’ve just raised guidance so it’s probably not going to be a dumpster fire of an event and the options are overpricing the downside risk.
This is how you can combine a quantitative backdrop with a qualitative context. And we haven’t even done any kind of traditional technical analysis, but I’m sure if you slap some lines on a chart you’re going to find some support.
So what’s the best way to trade it? A couple different ways but I can defer to my bread and butter setup, which is available to my favorite people in the world… Convex Spaces Clients:
