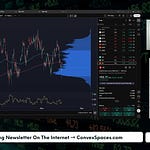
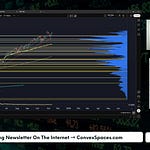
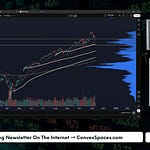
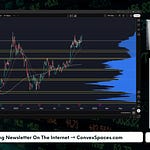
We’re Still Stuck in the Trading Range—And It’s Playing Out Exactly as Expected
For the past month, the market has been churning inside what’s become a brutally frustrating trading range. It feels awful, but structurally we’re still only ~5% off all-time highs.
This is classic corrective-range behavior:
Shake out weak hands
Fail the breakout
Fail the breakdown
Repeat until everyone is mentally exhausted
Breadth remains weak, with only ~35–40% of S&P components above their 50-day moving average. Momentum names have already retraced heavily, and now the “generals” (AAPL, MSFT, META, GOOG) are finally starting to wobble.
We’re closer to the end of the correction than the beginning.
Fear Is Real, But It’s Not System-Wide
The people who are truly uncomfortable right now are traders who bought the past 20 days of price action. Everyone else YTD is still sitting on gains.
This isn’t systemic fear—it’s positional pressure.
Momentum AI names? Already corrected.
Large-caps? Only recently starting to reflect fear.
Overall, this looks more like risk reduction than a full-blown unraveling.
Volatility Is Acting Odd—And That Matters
The VIX’s behavior around the 9am CT turn was unusually sharp. After dropping post-settlement, it snapped back higher, lifting implied volatility across the board.
Key detail:
Spot VIX ~24
10-day realized vol ~16.5
Also, expiring VIX futures created a rare convergence setup where November futures and spot aligned almost perfectly. The straddle setup sent to clients last week delivered a clean 100% winner—because this is exactly the type of environment where volatility can move violently with little warning.
Bottom line:
This is a derivatives-driven tape, not a macro-driven one.
The Mag-7 Debt “Tantrum”
Meta, Amazon, Oracle—several large tech names issued new debt to fund AI infrastructure, and equity markets didn’t take it well. The pushback isn’t about creditworthiness—it’s about:
Negative convexity from new bond supply
Cross-asset hedging pressure
High rates increasing sensitivity to financing decisions
Knee-jerk reactions to already-elevated valuations
Add in CoreWeave’s big summer debt raise and Blue Owl’s recent weakness, and you can see how the credit/equity relationship is distorting sentiment.
Still, relative to their revenue bases, these debt levels are small.
This is more mood-driven than fundamental.
Why Nvidia Earnings Could Trigger a Market Rally
Here’s the key insight:
Nvidia weekly options are massively overpriced.
Weekly IV: 119–130%
Historical earnings moves: much smaller
Correlated Mag-7 results: already known
This has created a giant volatility dislocation:
Traders bid NVDA weekly IV to extreme levels
Market makers gladly sell that volatility
To hedge, they buy cheaper vol in SPX/Nasdaq
This pushes index volatility higher (keeps VIX stubborn)
After earnings…
NVDA IV collapses → market makers unwind hedges
Index vol collapses
S&P and Nasdaq bounce 2–3%
None of this requires Nvidia’s numbers to be spectacular.
The mechanical vol unwind alone can spark the rally.
This is the most underappreciated driver of the current tape.
How to Position Without Burning Emotional Capital
Choppy ranges destroy confidence because bottoms rarely form cleanly.
Better approach:
✔️ Use limited-risk bullish structures
Call spreads, call calendars, diagonals.
✔️ Avoid short-dated calls
IV is too high—they won’t pay enough.
✔️ Avoid naked puts
The market may still test liquidity lower.
✔️ Scale into directional ideas
Being a week early is better than guessing the perfect tick.
I break down the exact structures—META included—in the members-only training.
Korean Retail Traders Are Quietly Moving Tech Momentum
A surprising datapoint:
Up to 30% of Ionic’s market cap at its peak was owned by Korean retail traders.
Their speculative behavior is different from U.S. traders and can drive huge swings in early-stage AI and quantum-themed equities.
I’m tracking these flows more closely—especially via social-signal analysis.
Ticker Q&A Summary
Unity (U)
Long-term base + AI positioning. April OTM calls still attractive if the broader market stabilizes.
Costco (COST)
Strong name, but early to short. Best setup: retracement → put calendars post-earnings.
Enphase (ENPH)
Residential solar struggles with high rates. Needs reclaim → pullback → breakout above 40 to build a base.
AVGO
Watching for a stop-run under 325 and potential failed breakdown—a classic high-probability setup.
Gold Miners
Gold may stall, but miners benefit from wide margins (high gold + low oil). Selective names look strong.
META
Structurally oversold. Good candidate for bounce structures—size appropriately.
Timestamps
(From transcript)
00:00 — Opening / overview
01:00 — Sentiment & correction context
02:00 — Trading-range structure
03:00 — Mag-7 scan
04:00 — Volume nodes & pivot structure
05:00 — Bottoming dynamics
06:00 — Liquidity pockets & EMAs
07:00 — Emotional vs financial capital
08:00 — Fear rotation & momentum unwind
09:00 — VIX behavior
10:00 — VIX vs futures pricing
12:00 — Hedging structures
13:00 — Mag-7 debt impact
15:00 — CoreWeave + Blue Owl
17:00 — Nvidia earnings theory
19:00 — Weekly IV distortion
20:00 — Volatility bleed-through into SPX
22:00 — Expected NVDA move
23:00 — VIX convergence trade
27:00 — Book rec
28:00 — Korean flow influence
30:00 — Positioning for bounce
32:00 — Member pitch
33:00–42:00 — Unity, COST, ENPH, AVGO, Miners, META
42:38 — Closing


