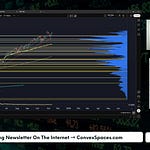
For ~100 trading days the Nasdaq has floated above its 50-day EMA. That’s five months of “higher for longer” momentum. The internet will tell you that means “crash.” It doesn’t. It means digestion. Sideways. Rotation. A pause that either refreshes—or quietly builds a bagholder shelf that finally breaks.
Meanwhile, the froth isn’t where CNBC is pointing. It’s inside the AI-infrastructure pocket where parabolics sprint until marginal buyers disappear. Then the floor vanishes. If you’ve ridden names like Oklo, Bloom, A-Labs or the data-center suppliers, you’ve felt this: +100% up in weeks… then −20% to −25% in two days. Normal for that habitat. Deadly if you confuse a great company with a crowded stock.
The Big Idea: S-Curves Don’t Die—They Hand Off
Every tech cycle is an S-curve: early convexity → over-build → saturation → reset. The current “software/model” curve (NVDA verticals, model hype, capex flywheels) can hand the baton to the Physical AI layer:
FSD & robotaxis (cars as robots)
Industrial & logistics robotics (dexterity breakthroughs)
eVTOL/aviation and autonomy
Small-scale “physical” AI: materials, protein design, novel energy storage
That’s where the next convexity hides.
The Bottleneck That Now Matters: Electrons
Yesterday’s constraint was chips. Today’s is power. You can’t scale inference without watts. That’s why nuclear/SMRs, gas peakers, and (yes) even coal are repricing from “unloved” to “necessary.” Energy as a sector is a tiny S&P weight versus the Mag-7—small boxes on the heat map, oversized optionality if the market recognizes we’re in an electrons arms race.
Implication: Energy isn’t a value backwater. It’s the financing layer for AI.
Why the Market Still Won’t Break (Yet)
Realized S&P vol is single digits while VIX and out-month VIX futures sit rich. Translation: hedges are expensive, crowded, and persistent. When everyone buys winter storm insurance during a windless August, dealers sit short vol and dampen realized moves. Selloffs keep failing because hedges get monetized into dips—mechanically creating a floor.
If you must hedge, be smarter than “buy puts and pray.” Consider:
Call-plus-short-beta overlays for convex downside with better carry
Poor man’s dispersion: e.g., buy relatively cheap single-name puts (AAPL/GOOGL) vs. sell index puts/own index to fund
How to Trade the Parabolic Pockets
Don’t chase front-side blowoffs. Wait for time (1 OPEX cycle) to rebuild bases. Sideways is your friend.
Map volume shelves. Thin air between shelves = fast air both ways.
Separate Company vs. Stock. Great narrative ≠ good entry.
Watchlist the Physical AI layer. FSD/robotics/logistics/eVTOL/biotech/materials. Let the set-ups come to you.
Energy = AI. Look across nuclear, gas, storage, and selective solar (FSLR/ENPH) but respect momentum’s cross-currents.
A Note on Froth
When stablecoin platforms whisper half-trillion valuations, ask the simple question: does it pass the sniff test next to real cash-flow compounds? These are not bottom signals. They’re late-cycle tells.
What to Do Next
Watch, don’t chase. Let parabolic baskets move sideways a month. If they’re still holding near highs, the liquidity structure just improved.
Rotate your hedge. If you’re long growth beta, pressure-test your protection. Expensive VIX ≠ effective insurance.
Build an Energy x AI screen. Power is the scarce input for the next leg of AI. That’s where misunderstanding = opportunity.
Want my exact entries/exits? I post them (plus institutional-grade research) for subscribers. Hit the button below and I’ll send you the next setup before it hits the timeline.
P.S. New annual members this week get my complete options training library—so you can execute the ideas, not just read about them.
Standard disclaimer: This is educational content, not investment advice. Markets risk real money; manage yours accordingly.
Key Timestamps / Chapters
00:00:17 – 00:03:13 • Setup: NDX streak above 50-EMA, why a pause > crash
00:03:13 – 00:04:44 • Stock vs. Company: liquidity gets “over its skis”
00:04:44 – 00:06:34 • Oklo example: thin liquidity pockets and bagholder risk
00:06:34 – 00:08:23 • Parabolic blow-offs: Bloom Energy case; typical −20% to −25% snaps
00:08:23 – 00:10:20 • A-Labs example; why rebounds take time (full OPEX cycle)
00:10:20 – 00:12:22 • S-Curve primer: positive → negative convexity as growth slows
00:12:22 – 00:14:07 • AI infra flywheel (NVDA/ORCL/OpenAI) & the question: is “this time different?”
00:14:07 – 00:16:20 • Next S-Curve = Physical AI layer (FSD, robotics, logistics, eVTOL, biotech, materials)
00:17:17 – 00:20:17 • Post-nuclear trade: power bottleneck is the constraint
00:20:03 – 00:21:31 • Energy’s tiny index weight; why it can re-rate (BTU example)
00:21:48 – 00:24:41 • Tether mega-valuation “sniff test” vs. JPM; signs of froth
00:25:18 – 00:29:34 • Why the market can’t crack: rich VIX curve, over-hedged positioning
00:31:32 – 00:33:46 • Smarter hedges: calls + short beta; poor man’s dispersion (AAPL/GOOGL vs. QQQ)
00:34:00 – 00:36:34 • Solar follow-through: FSLR/ENPH; TAN levels, momentum caveats
00:36:34 – 00:40:55 • AI infra names: wait for sideways “reset” before re-entries
00:41:00 – 00:44:41 • China trade: BABA squeeze, structure over top-ticking
00:44:41 – 00:46:11 • Batteries/FLNC: narrative tailwinds, manage bagholder shelves
00:46:11 – 00:47:16 • Builders/JHX: why the cycle looks heavy
00:47:22 – 00:48:26 • Wrap + offer/CTA


